Real stores. Real revenue.
The numbers below come from client store dashboards. Each one is defined so it's clear what it does and doesn't mean.
- Client store revenue influenced
- Revenue recorded in client store dashboards over the period Sigma worked on the store. Not a claim of revenue created by Sigma alone.
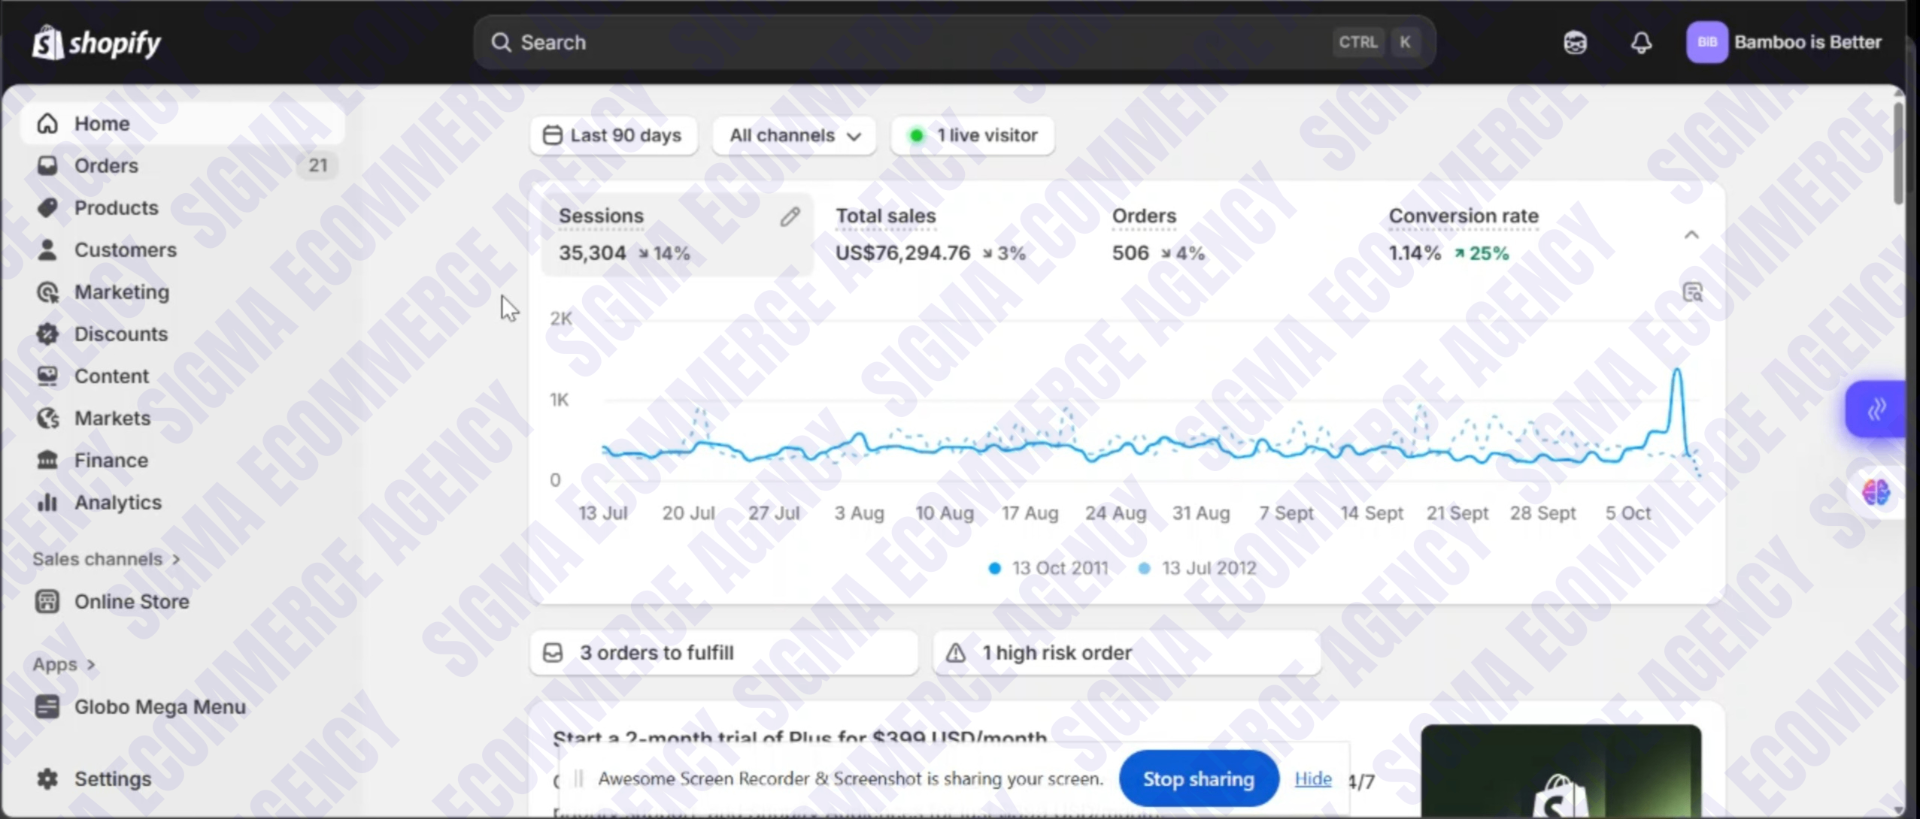
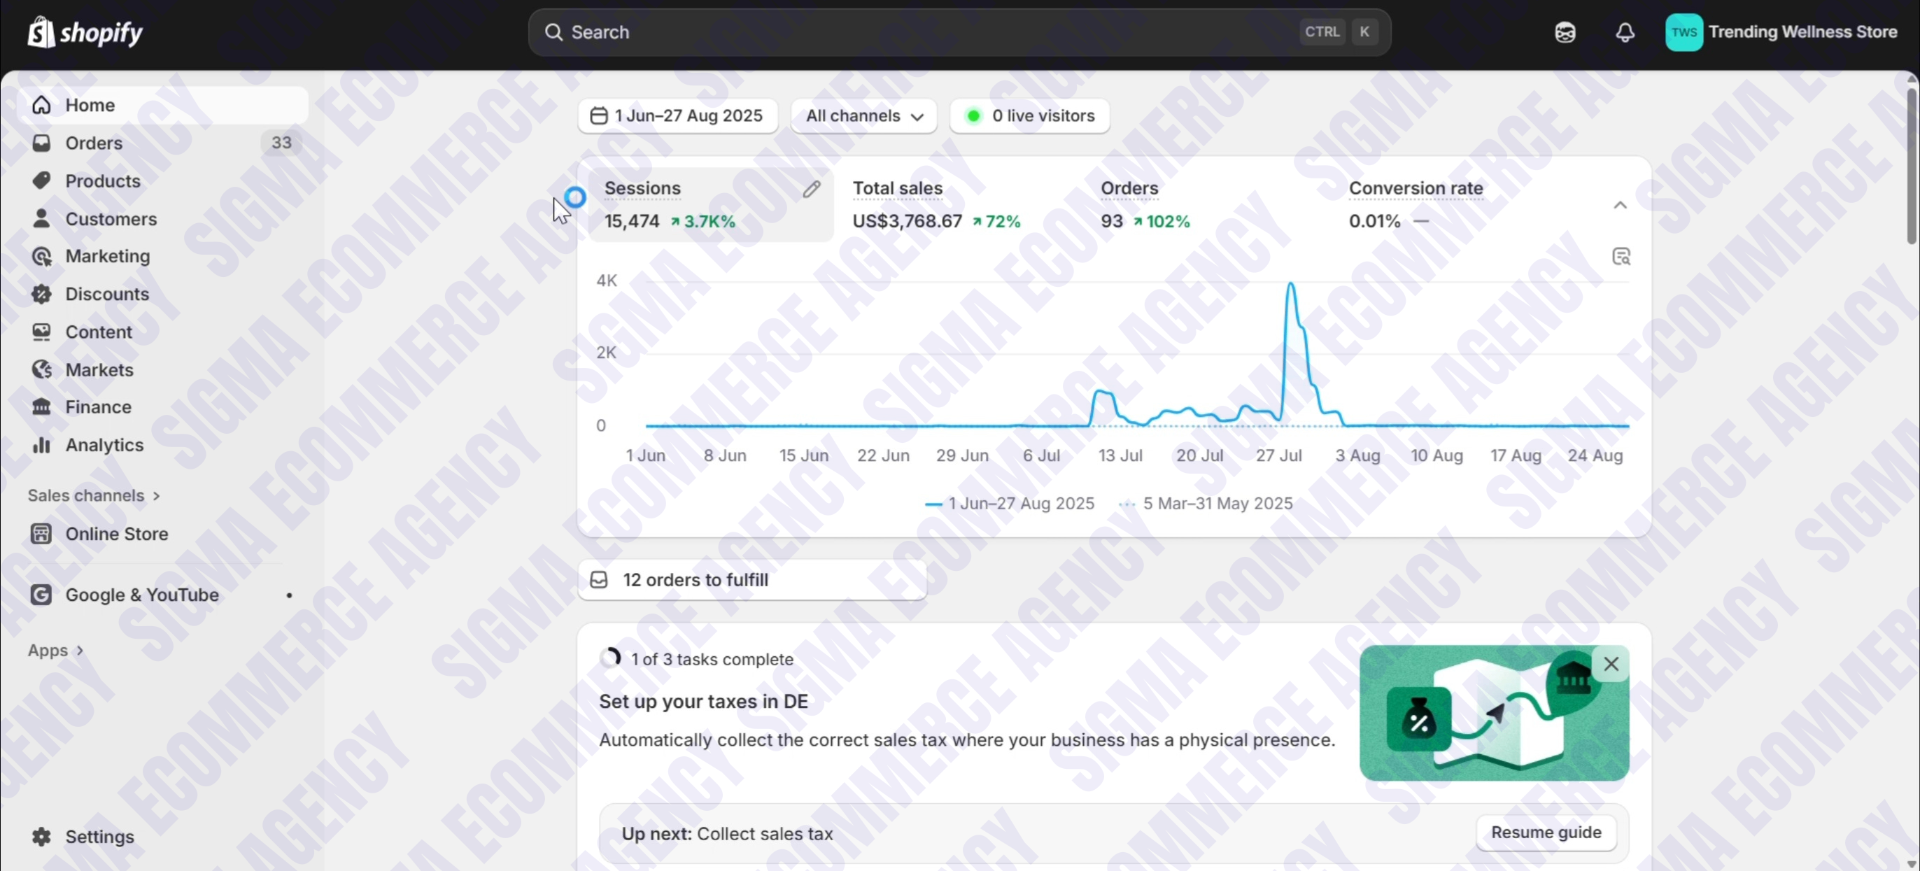
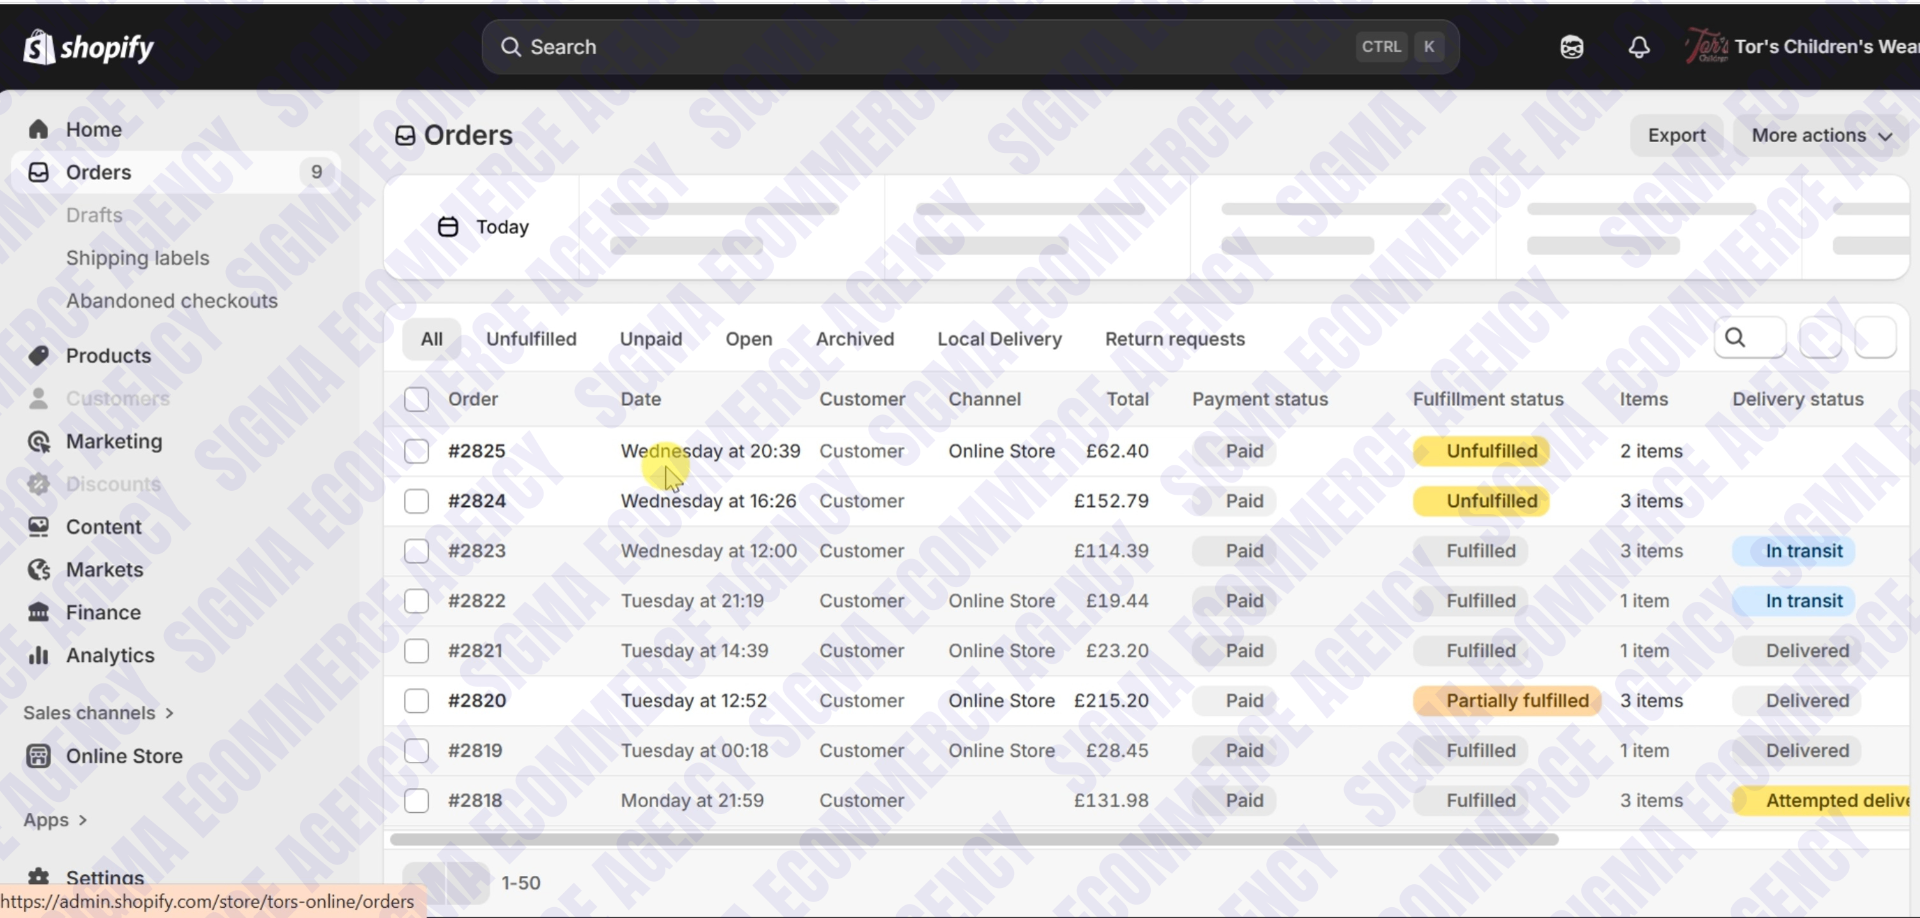
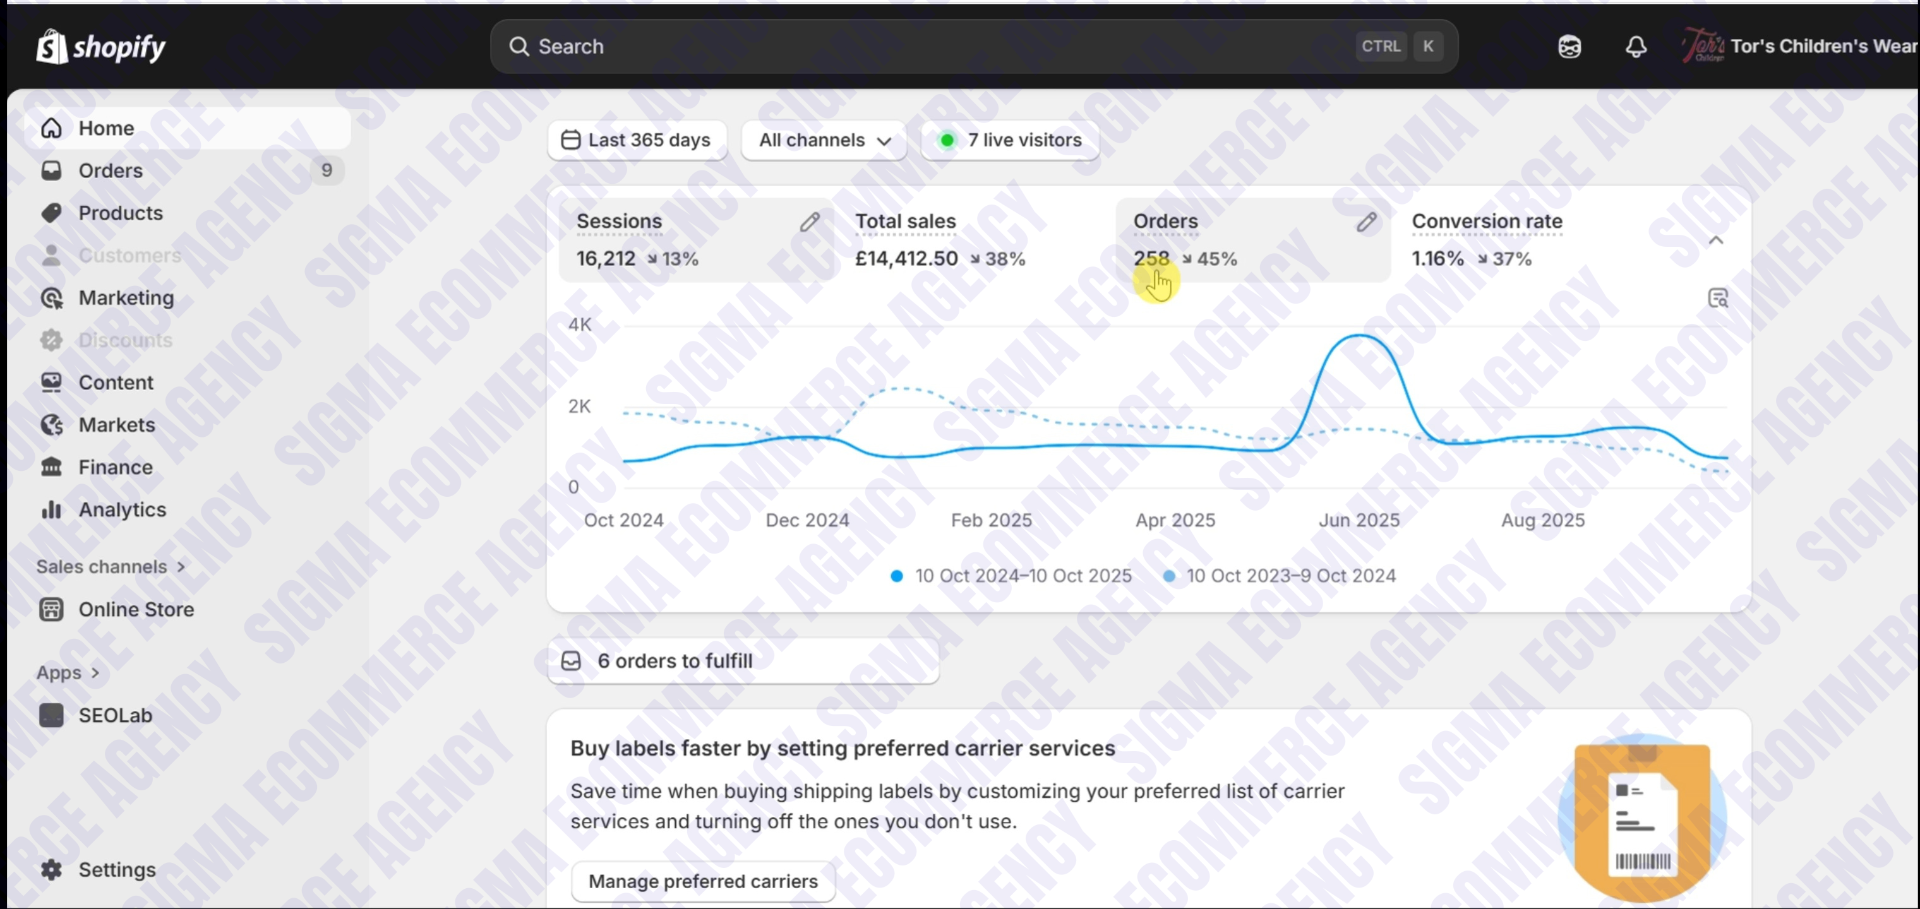
- Individual client revenue screenshots
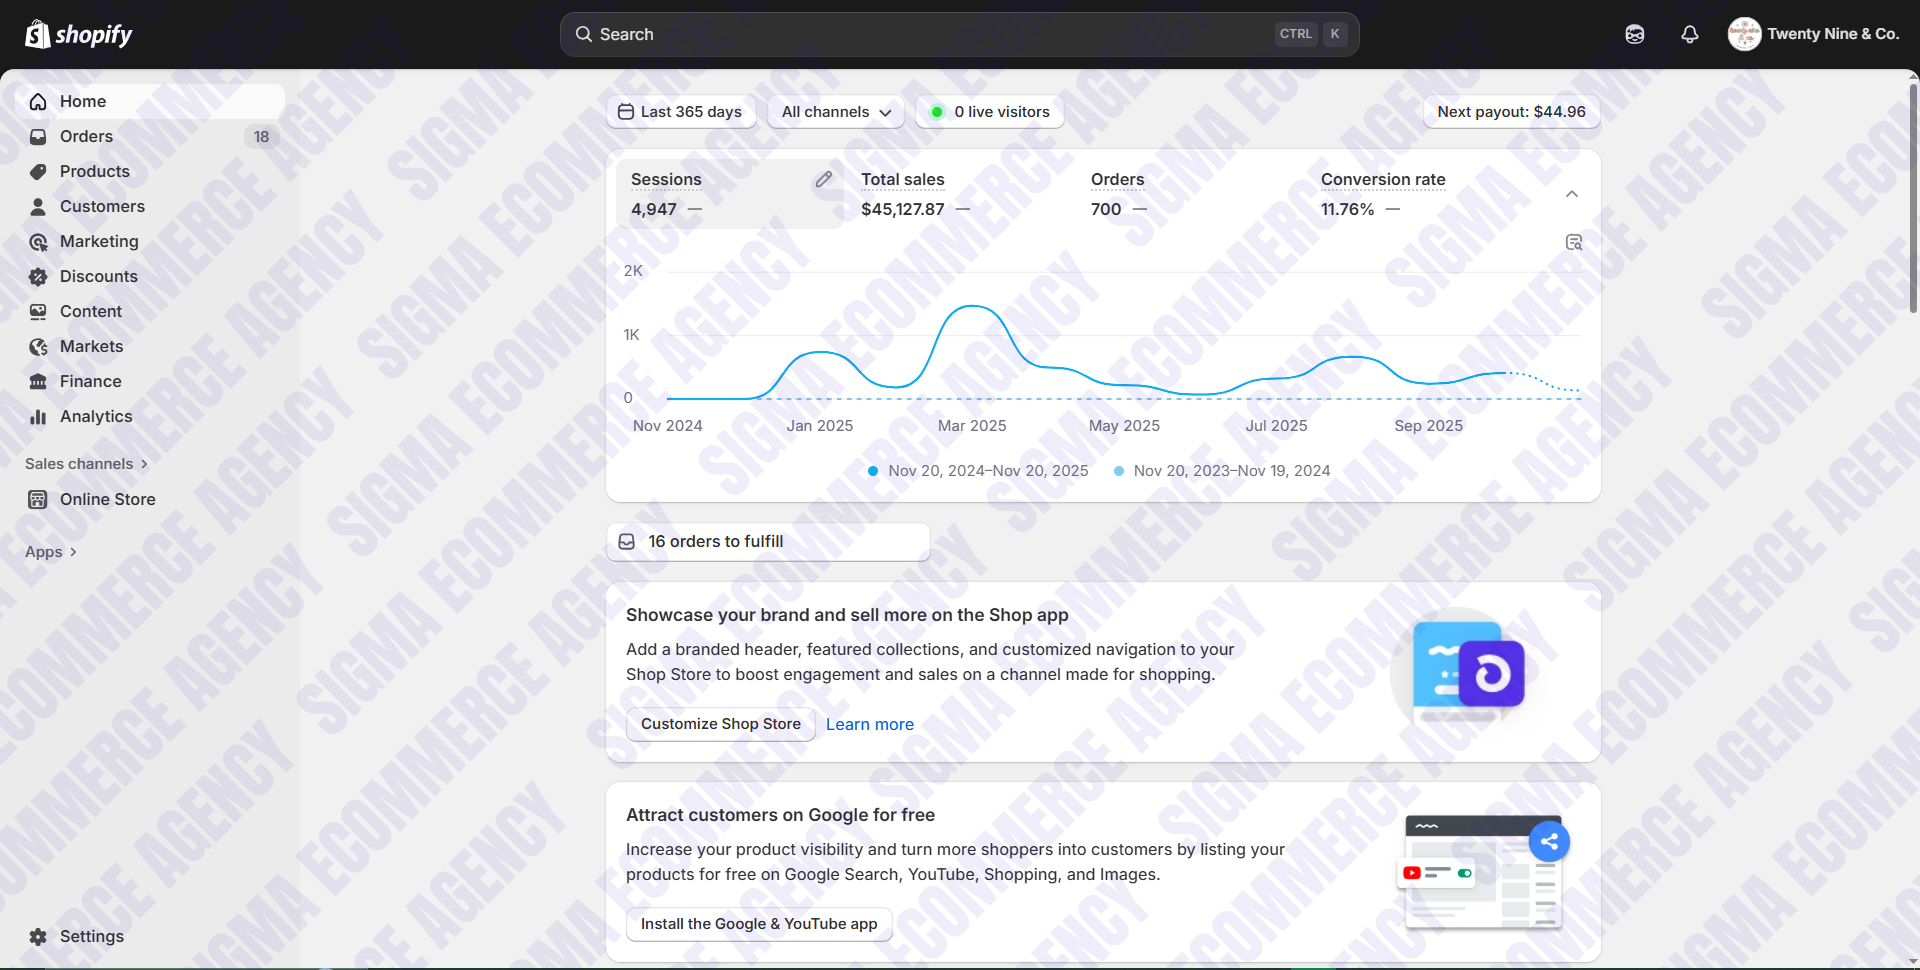
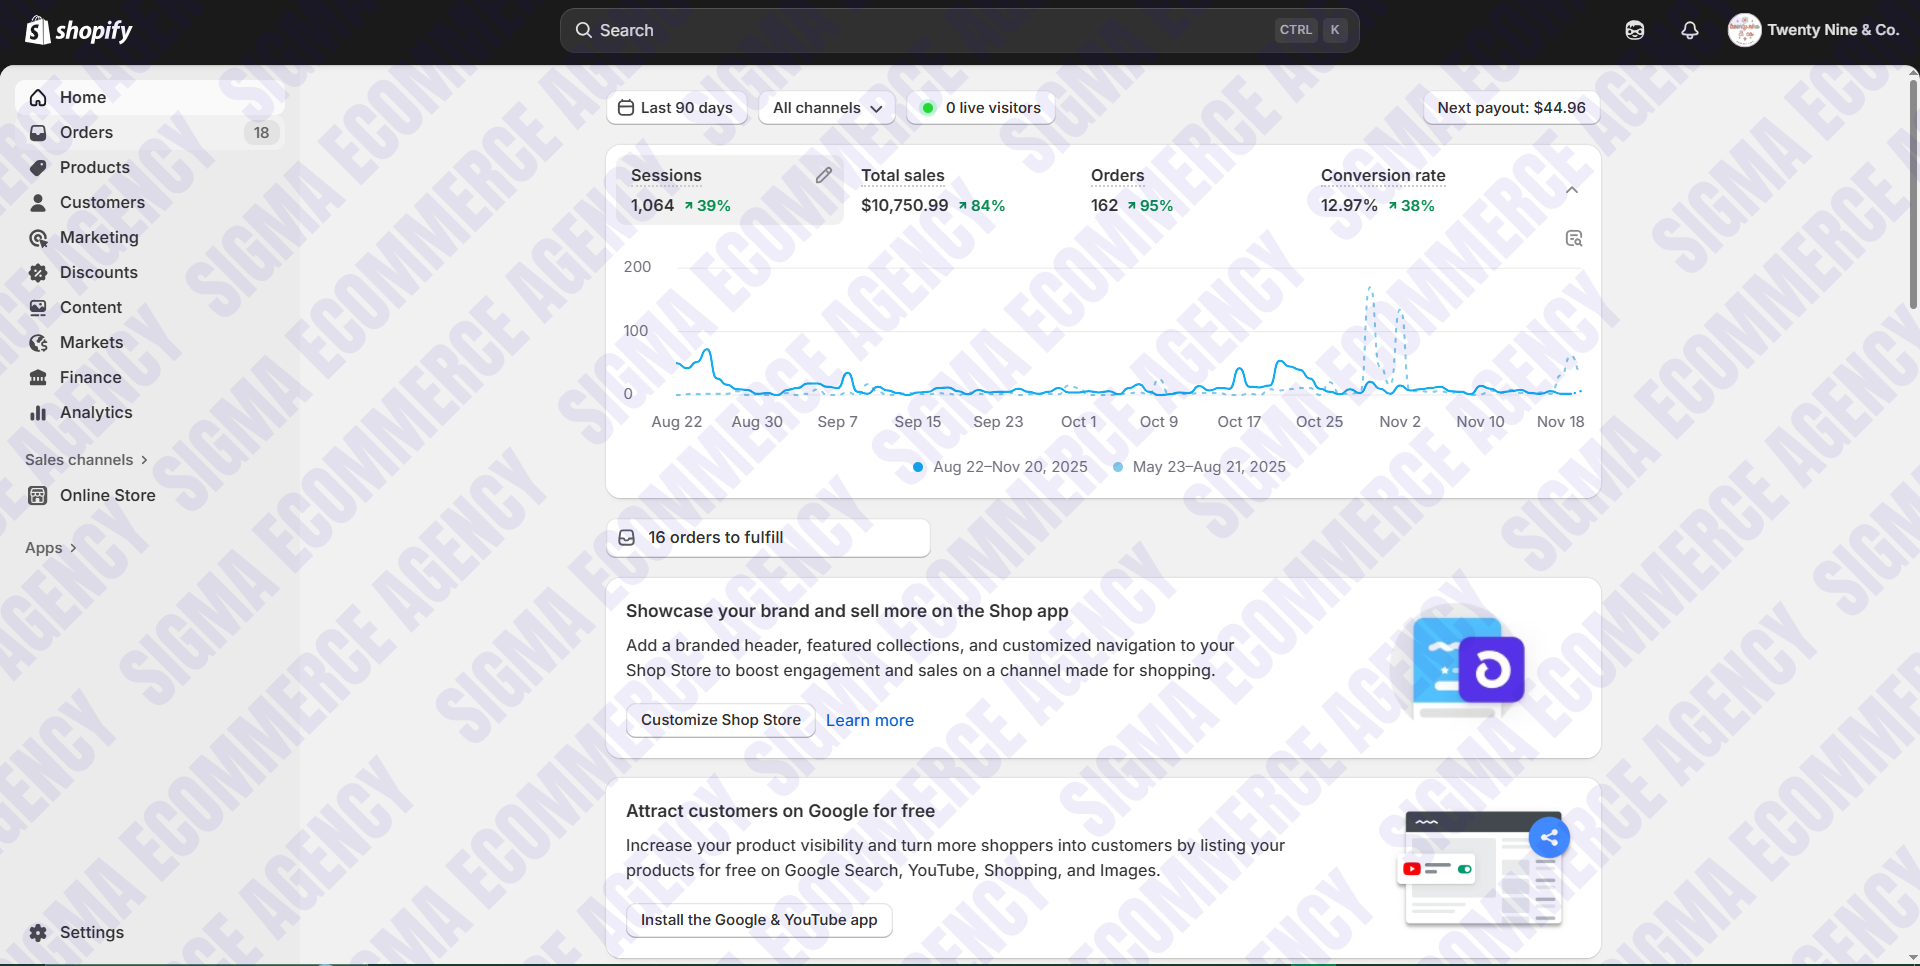
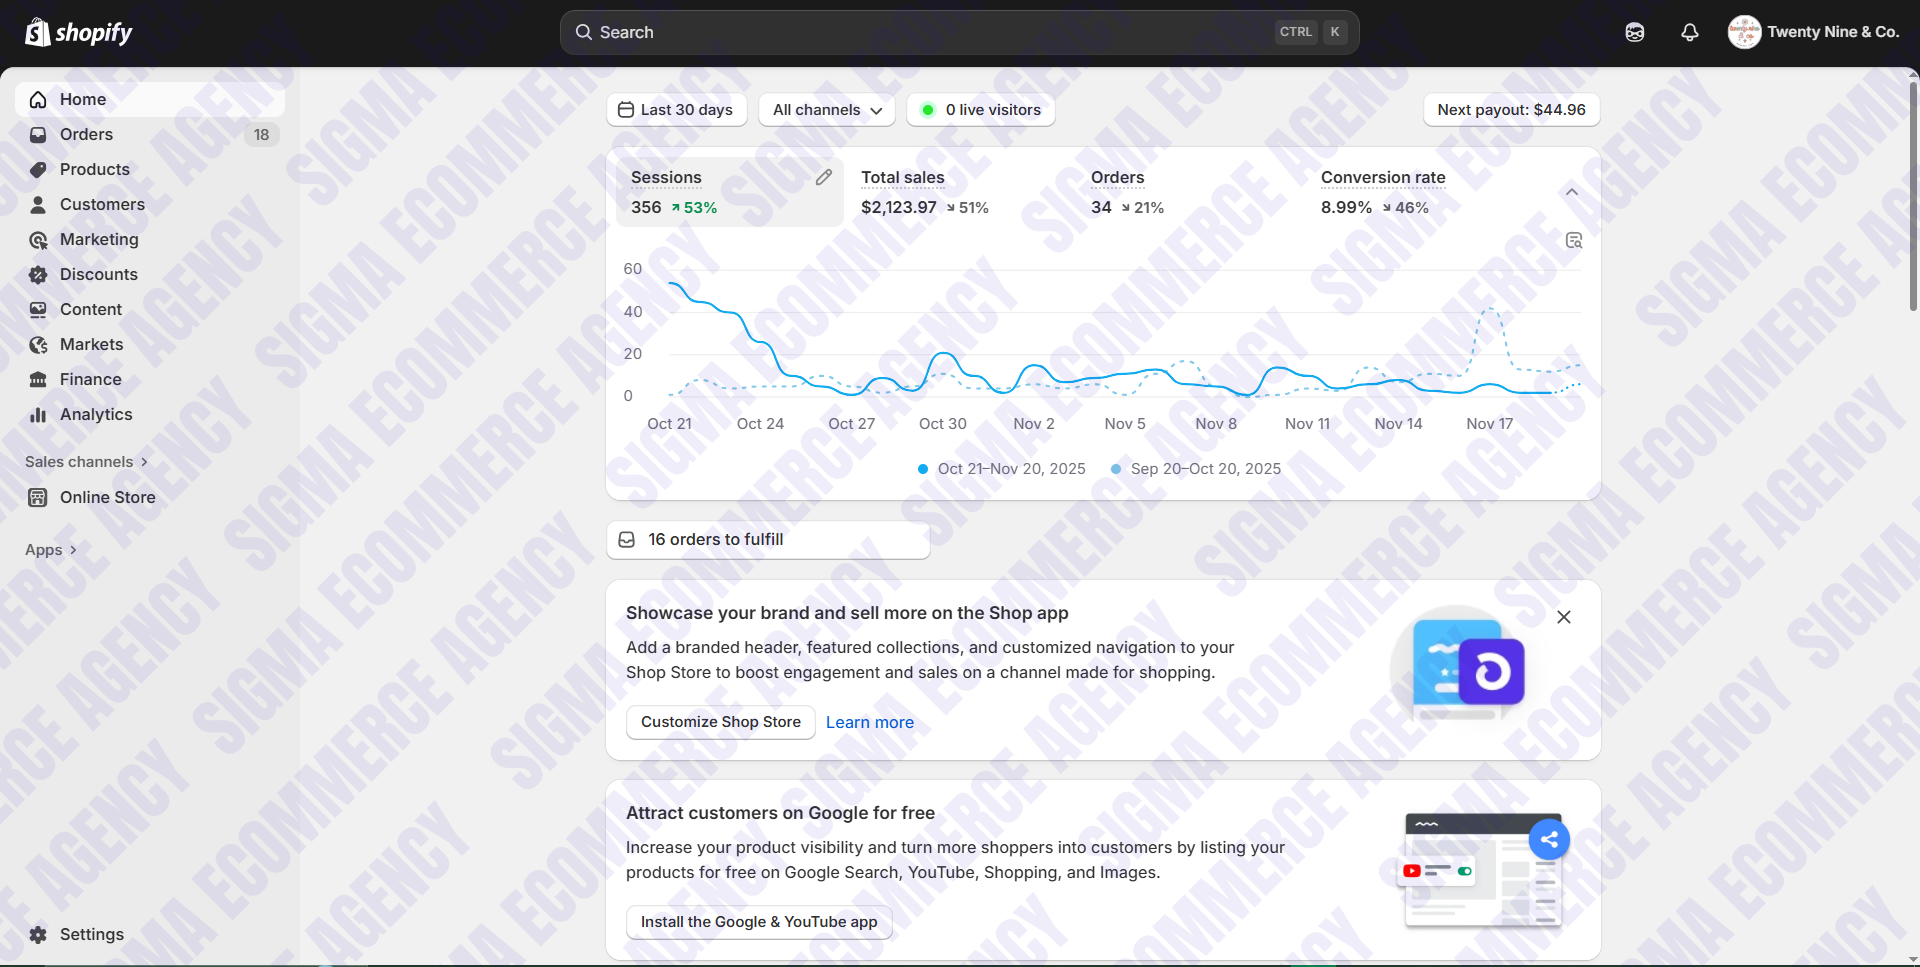
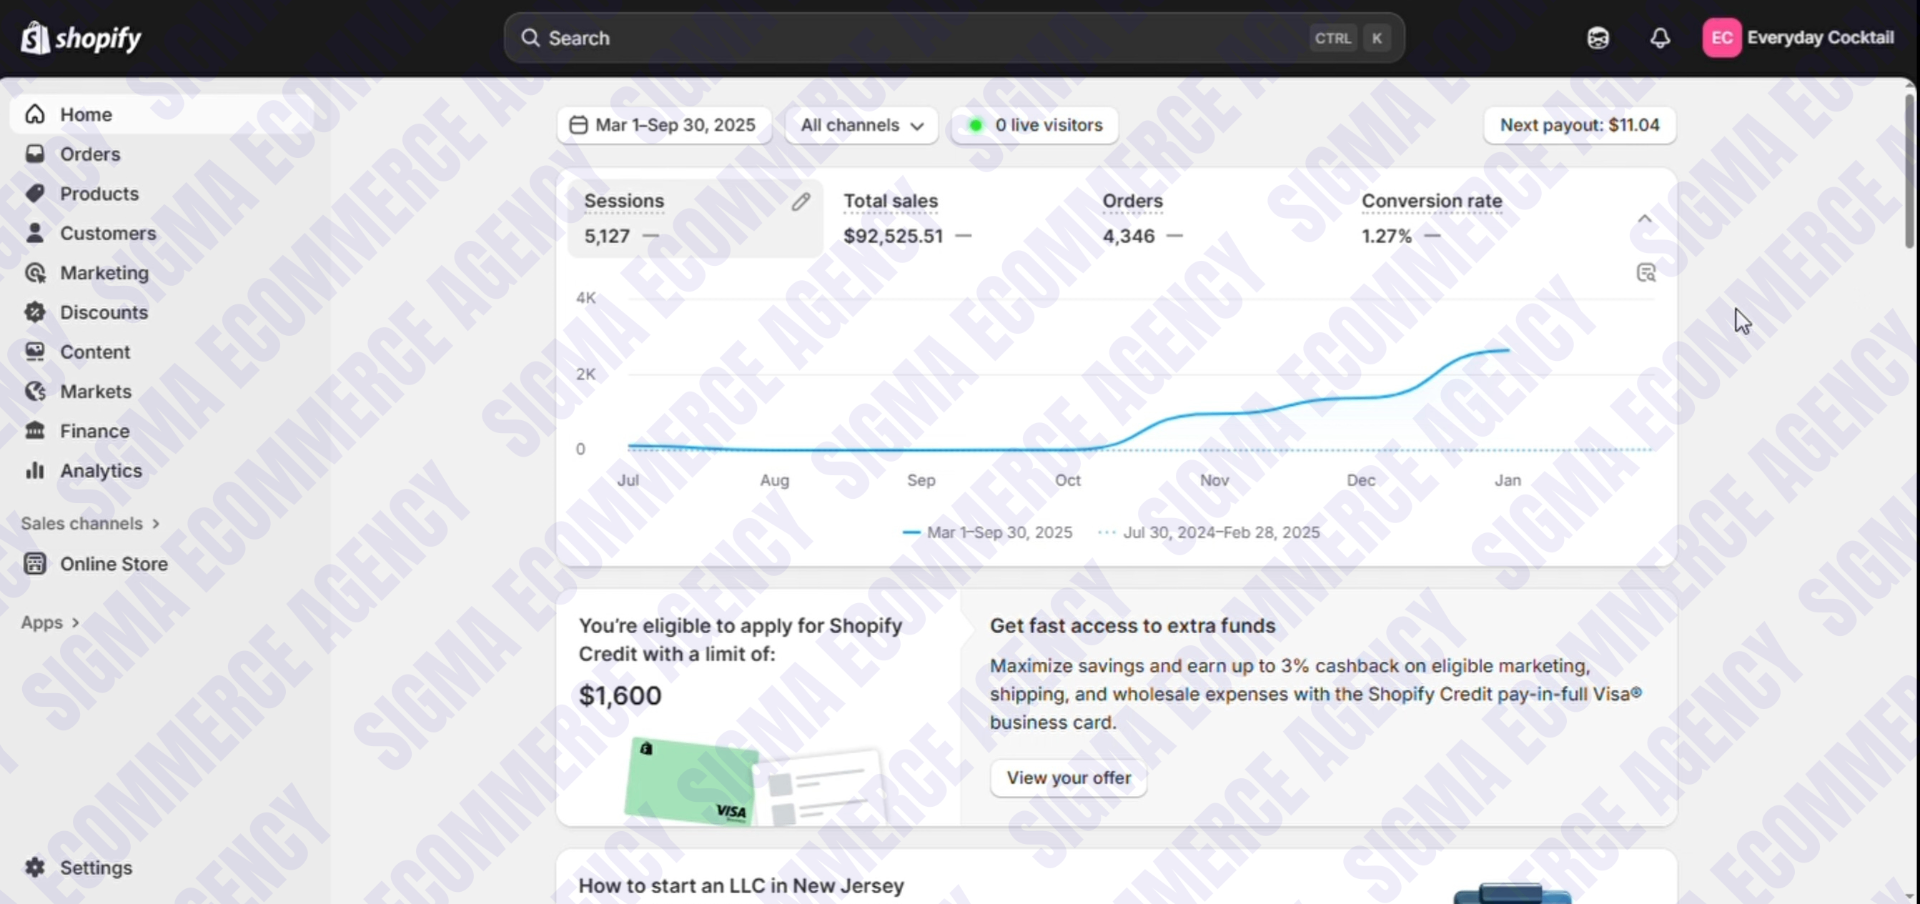
- Unedited dashboard snapshots from a single client store for the timeframe shown on the screenshot.
- Revenue attributed to campaigns
- [Insert definition once campaign attribution reporting is finalised]
- Conversion-rate improvement
- Store conversion rate after launch or optimization compared with the same store before, over comparable timeframes. Figures shown are the highest recorded, not an average.
- Stores & projects worked on
- Count of distinct ecommerce stores and project engagements delivered, including builds, rebuilds and optimization work.
- Countries served
- Count of distinct countries where clients are based.
Growth metrics that
move revenue.
Snapshots from client store dashboards for the timeframes shown. Figures below describe client store performance during Sigma engagements, not agency revenue.
Individual client revenue screenshots
Each screenshot shows one client store for the timeframe labelled on that card. These are single-store figures and are not additive.
Disclaimer
Dashboard screenshots shown are snapshots from client stores for the timeframe displayed in each screenshot. Certain client identities, commercially sensitive data and project details are withheld where required by confidentiality agreements. Individual results vary by product, market and stage. Past performance does not guarantee future results.